Analysis: CUSD likely to start growing soon, becoming majority Hispanic
Enrollment in the Cabrillo Unified School District (CUSD) may be about to increase for the first time in a decade if recent demographic trends continue, and the school population is about to become majority Hispanic.
Is the district, or the community, ready for these changes?
The total enrollment of CUSD grew at a fairly rapid pace until it peaked around 1997-98. It has been declining steadily ever since.

In 1996, the district forecast its enrollment of 3,900 would grow to 5,200 in 2008, and it planned for an aggressive expansion in its facilities. Today, the actual enrollment is 3,300. The steady fall in enrollment has taken a good deal of facilities pressure off the district.
The reasons behind the fall in enrollment are a subject of some debate, with flight to private schools and demographic changes being the most popular explanations.
But, the overall enrollment numbers don’t tell the whole story.
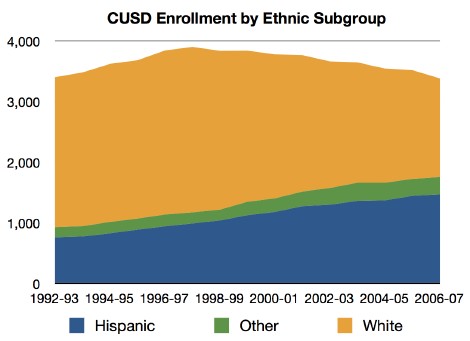
White enrollment has dropped rapidly since its 1996-97 peak. Meanwhile, Hispanic enrollment has grown steadily. Other subgroups have held relatively steady, at least as a group.
In the last 15 years, district white enrollment has dropped from 73% to 46% of the student population, while Hispanic enrollment has grown from 23% to 45%.
Countywide, where black and Asian students are a larger share of enrollments, the trends are generally similar, but all the trends are much less pronounced.

If we assume that the total enrollment will continue its current trend, we’d expect the district’s enrollment to continue to decline.

But if we project our three subgroups independently, we see a very different picture. White enrollment continues to decline, but the Hispanic enrollment is about to add more students than white enrollment is losing, reversing the decline in the very near future. Total enrollment may have bottomed out, having dropped by only seven students in 2008.
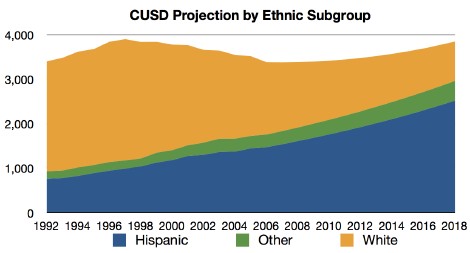
Hispanic enrollment is likely to overtake white enrollment by this fall, and it will be more than half of district enrollment in two years.
This analysis doesn’t consider new changes in demographic trends, the bursting housing bubble, changes in local employment patterns, and the state of the economy generally. But the basic trends have been consistent for a decade now.
While the district generally seems to be well-intentioned, there is little indication they are equipped for a dramatic shift in their student population. There have been no Hispanic members (or even candidates) on the district’s board in recent memory.
There are some encouraging signs, though. The new El Granada and high school principals have strong bilingual experience, and there have been impressive performance gains among El Granada Elementary’s Hispanic students. We’ll look at this in a future article.